

Open linked data Osservatorio Giovani della Regione Emilia-Romagna
This was a one-year project, funded by the city of Modena, in the research area of the Open Data and Open Government. The project goals were: to identify interesting data sources both from the open data community and from the private repositories of local governments of Emilia Romagna region related to the Youth Policies, in particular, to the topics of population, education and work; to integrate them and, to show up the result of the integration by means of a useful navigator tool; in the end, to publish new information as Linked Open Data.
The key partners in this project were the municipality of Modena, the Emilia Romagna region and the Dbgroup, under the scientific direction of Prof. Bergamaschi.
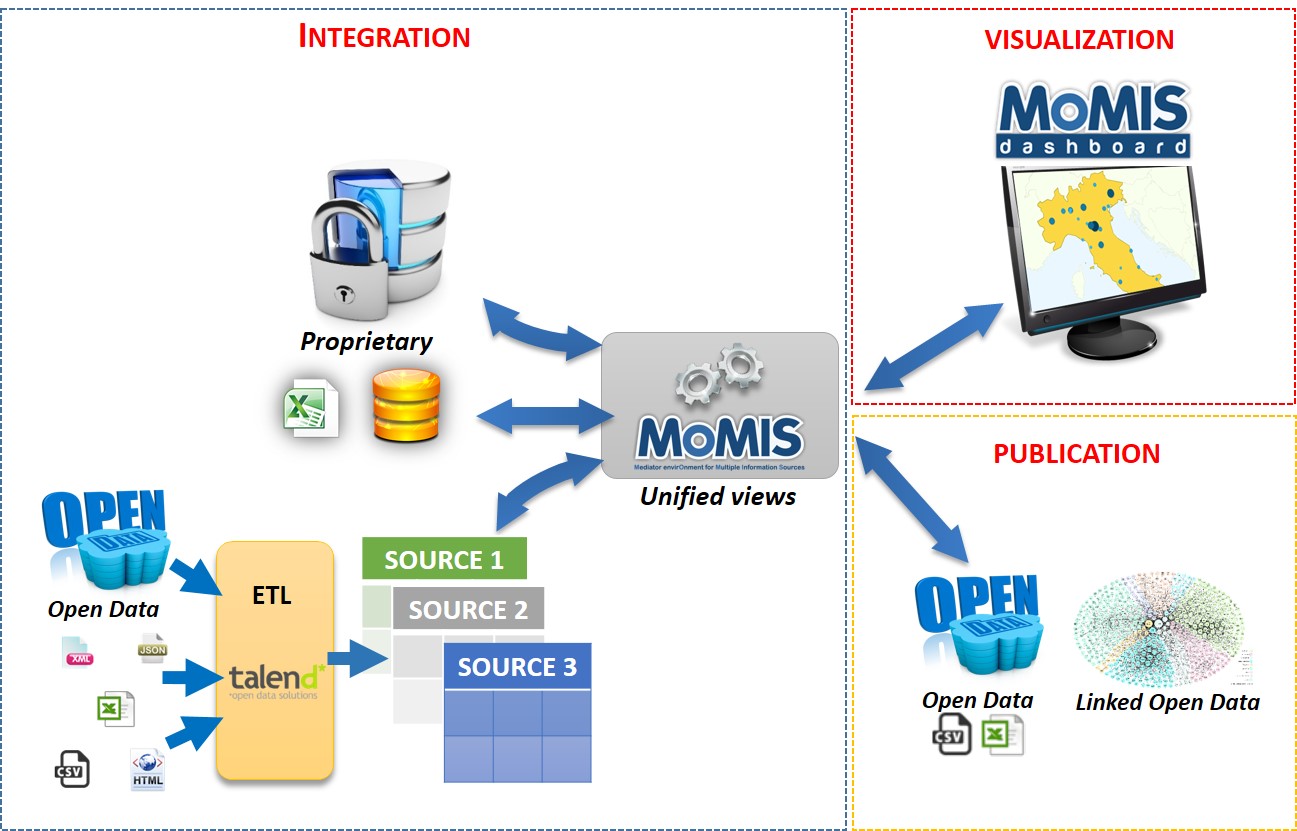
As you can see in the figure above the project has been developed in four phases:
- The first phase was devoted to a deep and wide analysis of the available data sources (local, regional, national and international) in order to individuate the most relevant ones.
- The second phase made use of the open source data integration system, MOMIS, to integrate the selected data sources in virtual global views.
- The third phase provided an easy-to-use dashboard, i.e. MOMIS dashboard, to visualize the information emerging from aggregated data.
- Finally, the fourth phase aimed to make the resulting valueadded information, public and searchable on the Web as Linked Open Data.
First phase: sources selection
In the first phase of the project, we focus on the selection of the most relevant data sources w.r.t the main dimensions of analysis of the project, i.e. municipalities and provinces of the Emilia Romagna Region. We have used and analyzed both proprietary and open data sources, the proprietary data sources was provided by the Emilia Romagna region, the sources were:
- A database of current spending projects: it contains information about the fundings provided for projects on youth populations actuated in the different provinces of the region;
- An excel file of capital spending projects: it contains information about funding provided for long period investments (e.g. build structures, equipments);
- A database of social centers (SAG - "Spazi diAggregazione Giovanile"): it lists all the places where young people get together or places where recreational activities for youth are organized;
- Three Excel files related to the youth information project ("Progetto Informagiovani"): The information centers provide data at local, national and international level on different topics of interest for young people aged 13 to 35 years. The main areas covered are relate to study, work, continuing education, travel and holidays, study and work abroad, leisure, social life and health. These files contain statistics about the number of visitors of the website, the number of points on the region and the number of editors;
- An Excel file about the Young ER Card project: YoungERcard is the new card designed by the Emilia Romagna region for young people aged between 14 and 29 residents, students or workers in Emilia Romagna. The card is distributed for free and reserve holders a series of facilities for the enjoyment of cultural and sportive events and discounts at various shops. The file reports information related to the Young Emilia Romagna Card distribution and extensiveness in the region.
Regarding open data sources, several sites and portals that publish information regarding the youth population have been investigated. Not all sources have revealed to be of interest/usable for the project and thus have not been included in the data sources to be integrated. At the end we have seletected this sources:
- Emilia Romagna Statistical Service: this website is divided into several thematic sites that report information on population, transport, sports, productive sectors, etc.. For our project, we focused on the "population" and "education" sites.
- National Student Register - MIUR: this register, provided by the Italian Ministry of Education, University And Research, contains information on the number of students and graduates in the various degree courses of Italian universities.
Our work of selecting sources and extracting relevant data was driven by few relevant questions arising by the local and regional politicians: "how many funding was provided in any province compared to the number of youth residents (aged 15-34)?", "which is the higher education rate in each province?".
These questions have to be answered in an historical perspective, thus monitoring the data of each province over the years. To effectively answer these questions, we selected, among the available sources, the ones that supply the number of young residents in each province and their level of education. The data on the youth population have been extracted from the Emilia Romagna Statistical Service, while the data on education have been extracted from the National Student Register. The data that was required had to be aggregated by province and year, therefore a preliminary study on which dimensions were provided on these data sources was needed. The sources have different dimensions and different level of granularity, thus we needed to select appropriate dimensions to allow a successful integration.
From the Emilia Romagna Statistical Service, we extracted the number of male, female and total population with respect to the following dimensions: Year, and Province. From the National Student Register, we extracted the number of matriculates, graduates and registered with respect to the following dimensions: Academic Year, and Course Province. Since the academic year is described by a couple of years (e.g. 2012/2013), we applied a conversion function to transform it to a single year. Our decision was to take the first part of the academic year for represent the enrolling year (usually people enroll in the first part of the academic year) and the second part to represent the year of graduation (usually students get their degree in the second part of the academic year).
Some naming conflicts occur on the province names. The main problems were found on the provinces of Reggio Nell'Emilia and Forlģ-Cesena that were written in different ways, for example "Reggio Emilia", "Reggio-Emilia", "Forlģ e Cesena", "Forli-Cesena".
For solving this problem, we choose as golden standard the names used on the Regional Statistical Service, namely "Forlģ-Cesena'' and "Reggio Nell'Emilia'', and we converted any other forms to the gold standard.
Second phase: data integration
At the end of the first phase of data extraction and transformation, we had the following data sources:
- Current spending projects: information about funding provided for projects on youth populations actuated in the different provinces of the region;
- Capital spending projects: information about funding provided for long period investments (e.g. build structures) organized for each province and year;
- Number of youth residents: number of youth residents in each province of the region Emilia Romagna and for each year;
- Number of Youth Information Centers: numbers of points of the Youth Information Centers located in each province and year.
- Number of editors in the Youth Information Centers: number of member in the editorial staff operating in the Youth Information Centers for each province and year.
- Number of web site visitors Informagiovanionline: information about the number of the visitors to the website Informagiovanionline for each province and year.
- Young ER Card: data on the Young ER Card for each province and year.
- Number of graduates supply by MIUR: information about the number of graduated for each province and year.
- Number of matriculations at the university supply by MIUR: information about the number of matriculations for each province and year.
All these sources have two dimensions in common: the year and the province. We conducted two analysis for evaluating the data coverage over the two dimensions. We found no lack of data over the provinces, meaning that the data are spread in all the provinces. Instead, focusing on the entire interval of years (2006-2014), we found a relevant number of missing data, that is reported in the table below.
| Source | Year | ||||||||
| 2006 | 2007 | 2008 | 2009 | 2010 | 2011 | 2012 | 2013 | 2014 | |
| 1 | |||||||||
| 2 | |||||||||
| 3 | |||||||||
| 4 | |||||||||
| 5 | |||||||||
| 6 | |||||||||
| 7 | |||||||||
| 8 | |||||||||
| 9 | |||||||||
To integrate our sources we used MOMIS a system able to aggregate data coming from heterogeneous data sources, you can find all the informations about MOMIS on DataRiVer.
Since MOMIS allows the creation of more virtual integrations, called Global Schemas, to avoid a proliferation of null values in the integration result, we created three different Global Schemas:
- GS-Global: this GS contains the data from all the nine sources, on this GS we created a view that it is used in the MOMIS Dashboard (see next chapter for details) and includes only data of 2014;
- GS-Projects-Informagiovani: this GS excludes the Young ER Card from the integration; On this integration, we were interested to show the correlations between the data of the Informagiovani project and the data of education and founded projects; thus we created a view on the period 2009 - 2013, where most of these sources have available data.
- GS-Projects: this GS considers only sources 1, 2, 3, 8 and 9, in order to create charts on the entire period that show the correlation between founded projects, population and education.
Third phase: data visualization
To visualize the integrated data we used the MOMIS Dashboard, an interactive visualization tool developed by DataRiVer that offers several views on a set of data. It makes easier to compare data and capture useful information. It allows to filter the data and visualize the results through different charts. In particular, it is possible to display line charts (for showing trends), barcharts, pie charts, bubble charts on a Google Maps, or show the data in a tabular view.
Here are some of the charts that we have created to answer the politicians questions.
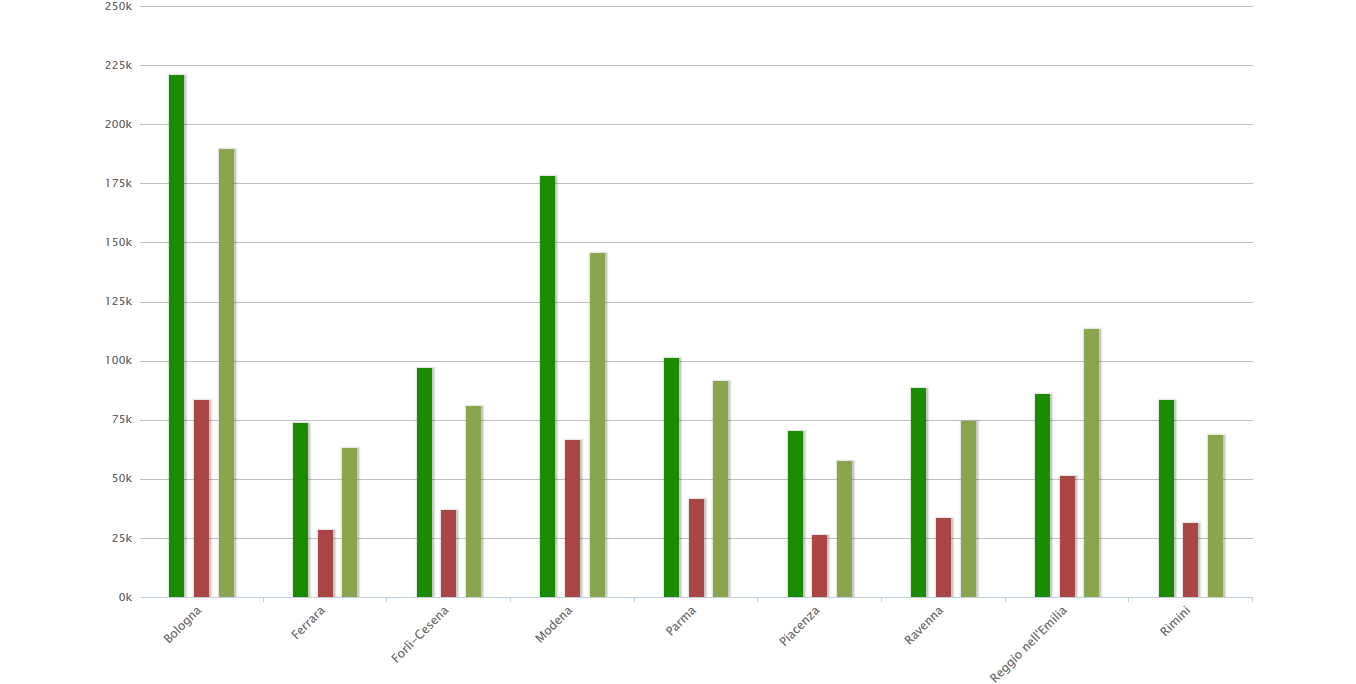
A bar chart comparing fundings and youth population (in light green). |
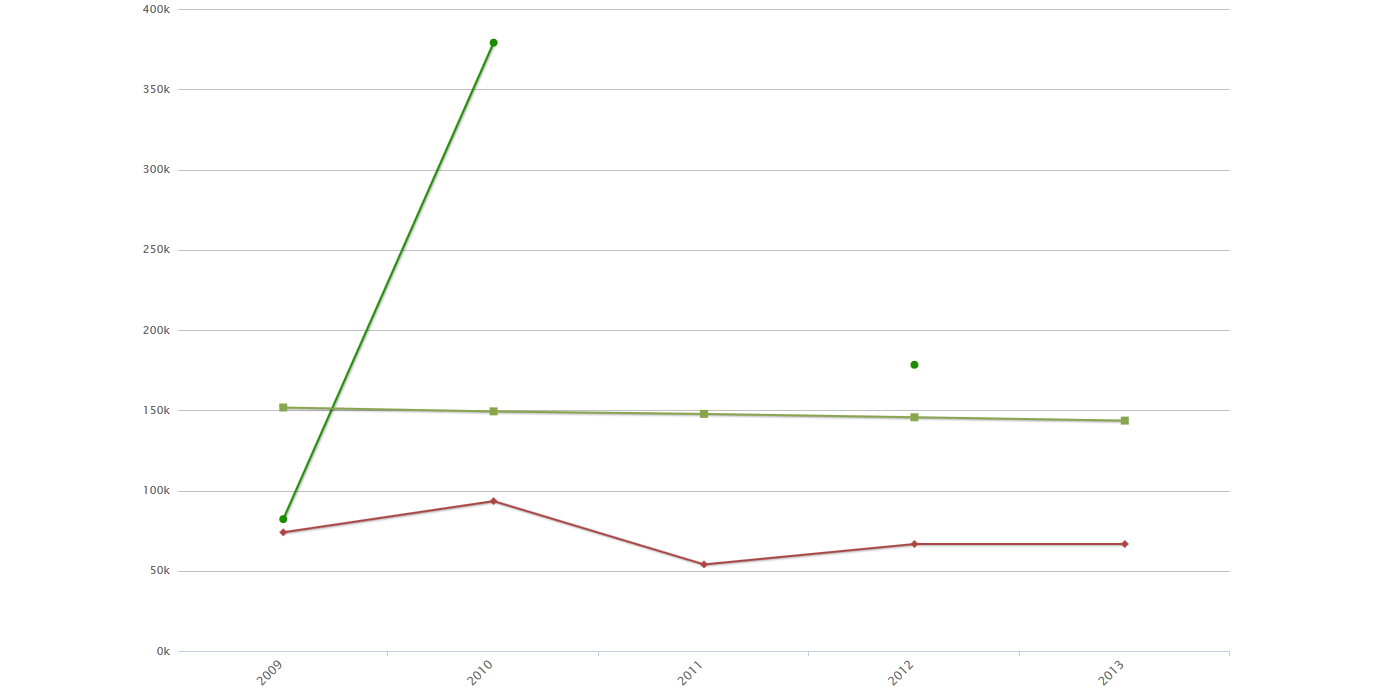
Fundings and youth population (in light green) trends in the province of Modena from 2009 to 2013. |
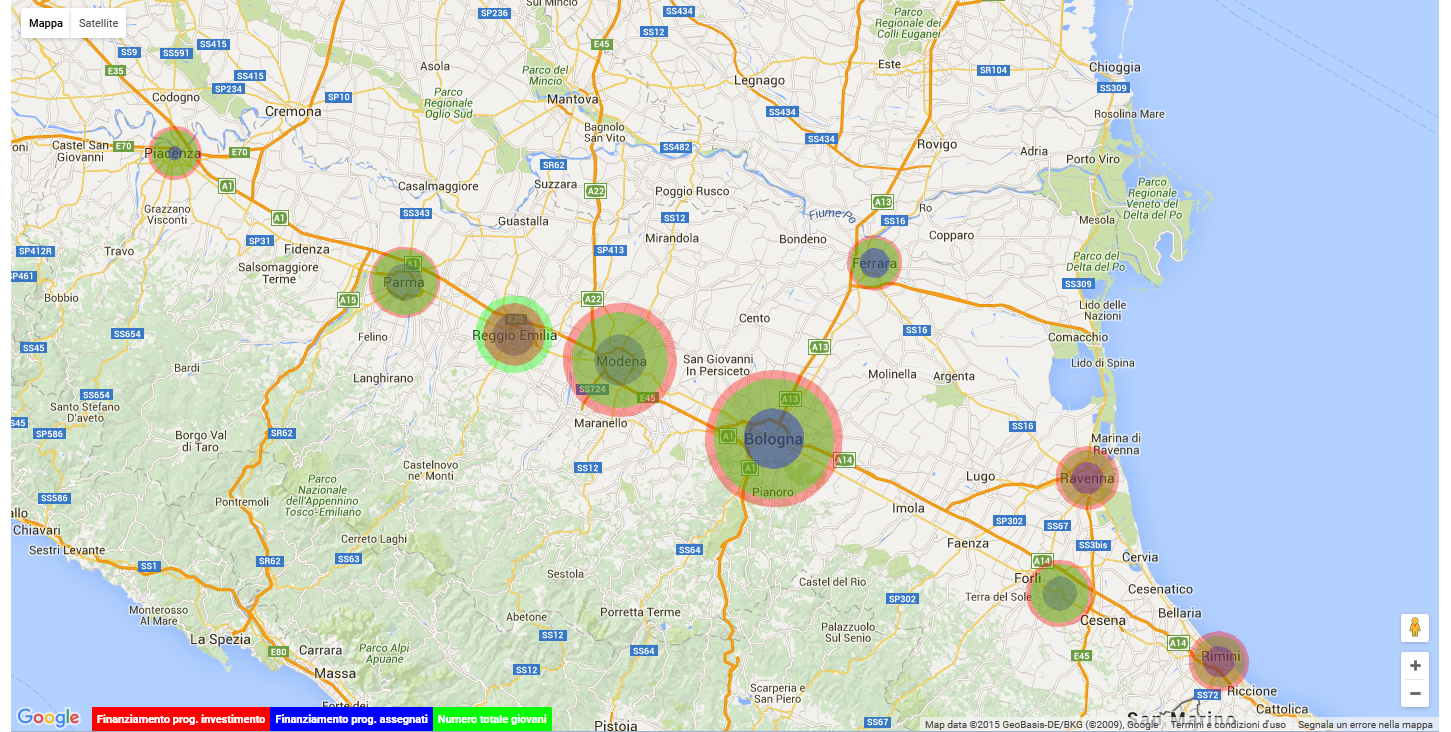
A map comparing fundings and youth population (in light green). |
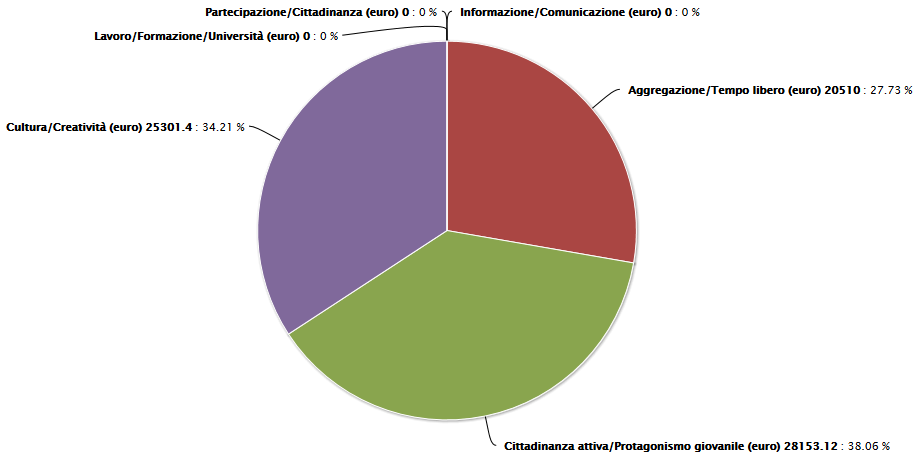
Funded projects/areas in the province of Modena on 2009 |
Fourth phase: publishing Linked Open Data
In order to publish in the LOD cloud the project results, we needed a tool for mapping a relational source in RDF. The tools for automatic mapping generation define a set of mappings between RDB and RDF namely: an RDB record is a RDF node, the column name of an RDB table is a RDF predicate and an RDB table cell is a value. Among these tools, we selected D2RQ as it allows users to define customized mappings.
Using D2RQ we have connected our data with DBpedia and GeoNames.
You can explore the result of data conversion by clicking here.
Once a LOD dataset is available, a tool to navigate, explore and query it is necessary. We exploited LODeX, a tool able to provide a summary of a LOD source starting from scratch, thus supporting users in exploring and understanding the contents of a dataset. Moreover, LODEX provides a visual query interface to easily compose queries, that are automatically translated in Sparql and executed on a LOD source.
You can try LODeX on our dataset by clicking here.
Conclusion
In this page we have shown the results gained during the "Open linked data Osservatorio Giovani della Regione Emilia-Romagna" project . We consider our work can be helpful for future open government projects aiming to exploit and public open data.
Categorie: Projects